The Peaks and Troughs: Unraveling the Dynamics of Bull and Bear Markets
Unravel the intricacies of financial market cycles in our detailed exploration of bull and bear markets. This comprehensive article delves into the psychology of market participants and the dynamics of market participation, providing a fresh perspective on why bull markets have sharper peaks and bear markets have more prolonged troughs. Discover how emotions like fear and greed, coupled with varying levels of market participation, shape the peaks and troughs of these market cycles. Whether you're an investor or simply curious about the financial markets, this insightful post offers valuable knowledge to help you understand the ebb and flow of the financial markets.
STOCK MARKETFINANCIAL EDUCATIONMARKET VOLATILITYMARKET PSYCHOLOGYSUPPLY AND DEMANDMARKET DYNAMICSECONOMIC CONDITIONSFINANCIAL MARKETS
Introduction
The financial market is a complex ecosystem driven by numerous factors, including economic indicators, corporate earnings, geopolitical events, and investor sentiment. However, one of the most intriguing aspects of this ecosystem is the cyclical nature of markets, characterized by alternating periods of bull and bear markets. This article delves into the dynamics of these market cycles, focusing on the thesis that peaks in bull markets are sharper than troughs in bear markets due to the stronger influence of mania compared to panic, and the larger participation in bull markets than in bear markets.
The Anatomy of Bull and Bear Markets
Bull and bear markets are distinguished by the direction of market trends. A bull market is characterized by rising prices and optimism among investors, while a bear market is marked by falling prices and pessimism. These market phases are not merely defined by price movements but also by the psychology of market participants.
Bull Markets: The Ascend and the Peaks
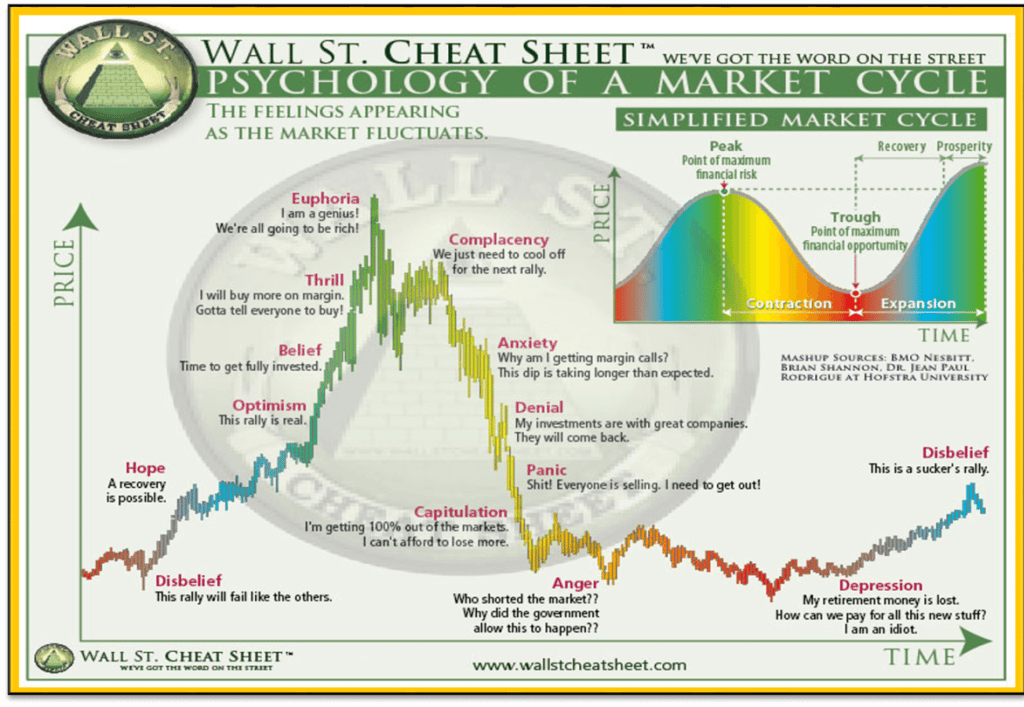
Bull markets typically start with a phase of accumulation, where savvy investors begin to purchase stocks, believing that good times lie ahead. As more investors join in and the market gains momentum, we enter the second phase, the mark-up phase, where prices rise steadily. This phase is often accompanied by increased media coverage and growing interest from the public. The optimism and euphoria can lead to inflated expectations and overvaluation, creating a speculative bubble.
The final phase is the distribution phase, where smart money starts to sell off stocks, often leading to the sharp peaks observed in bull markets. This phase is characterized by extreme optimism, greed, and a belief that the market will keep rising, often ignoring fundamental economic indicators.
Bear Markets: The Descend and the Troughs
Bear markets, on the other hand, begin with distribution, where smart money starts selling off stocks due to the perception that economic decline or negative market shift is on the horizon. This is followed by a panic phase, where prices plummet as most investors follow suit, leading to a market crash or steep decline. The final phase is the despondency phase, where the market sentiment is extremely negative, and most investors have exited the market. This phase is characterized by fear and capitulation, leading to undervalued prices and setting the stage for a new bull market.
Unlike the sharp peaks in bull markets, the troughs in bear markets are more prolonged. This is because fear, the dominant emotion in bear markets, tends to make investors more risk-averse and slower to act, leading to a more gradual bottoming process.
The Psychology of Market Participants
The dynamics of bull and bear markets are deeply rooted in the psychology of market participants. In bull markets, the dominant emotions are optimism and greed. Investors are driven by the fear of missing out (FOMO), leading to increased participation and a herd mentality. This collective optimism and the subsequent mania can drive prices up rapidly, leading to sharp peaks.
On the other hand, bear markets are driven by fear and pessimism. Investors are more likely to sell their holdings to avoid potential losses, leading to a downward spiral of prices. However, the fear also makes investors more cautious, leading to slower decision-making and more drawn-out troughs.
The Role of Market Participation
The level of market participation also plays a significant role in shaping the dynamics of bull and bear markets. Bull markets generally see higher levels of participation, with more investors willing to buy into the market in anticipation of future price increases. This increased demand can drive up prices rapidly, contributing to the sharp peaks observed in bull markets.
In contrast, bear markets often see reduced participation, with fewer investors willing to buy into a falling market. This lack of demand, coupled with an increase in supply as investors sell off their holdings, can lead to a more gradual decline in prices, resulting in more drawn-out troughs.
Supply and Demand Dynamics
Market dynamics refer to the forces that impact the prices and behaviors of producers and consumers. These forces create pricing signals, which result from the fluctuation of supply and demand for a given product or service. In the context of financial markets, these dynamics can significantly influence the price action we observe.
Supply and demand are the fundamental drivers of price in any market. In financial markets, those who supply financial capital through saving expect to receive a rate of return, while those who demand financial capital by receiving funds expect to pay a rate of return. This rate of return can come in a variety of forms, depending on the type of investment. For instance, when you deposit money into a savings account, you receive interest on your deposit, which is the rate of return. Conversely, if you take out a loan to buy a car or a house, you will need to pay interest on the money you borrow, which is the cost of obtaining financial capital.
The dynamics of supply and demand in financial markets are influenced by a variety of factors. On the supply side, factors such as interest rates, economic outlook, and investor sentiment can influence how much capital is available for investment. On the demand side, factors such as borrowing costs, investment opportunities, and economic conditions can influence the demand for financial capital.
In a bull market, the demand for financial capital typically exceeds the supply, leading to rising prices. This is often driven by positive investor sentiment and favorable economic conditions, which encourage more participants to enter the market. The increased demand and limited supply lead to sharp price increases, creating the characteristic "peaks" of a bull market.
In contrast, in a bear market, the supply of financial capital often exceeds demand, leading to falling prices. This can be driven by negative investor sentiment and unfavorable economic conditions, which cause many participants to exit the market. The decreased demand and excess supply lead to a more gradual decline in prices, creating the characteristic "troughs" of a bear market.
The dynamics of supply and demand also explain why the bottoms in bear markets are much more drawn out and not as sharp as the peaks in bull markets. In a bear market, the excess supply of financial capital and decreased demand can take a longer time to balance out, leading to a more prolonged bottoming process. In contrast, in a bull market, the excess demand and limited supply can lead to sharp price increases, creating a steeper ascent to the peak.
Moreover, the dynamics of supply and demand are not always rational. Emotions such as fear and greed can significantly influence market participants' decisions, leading to overreactions that can exacerbate price movements. This is particularly evident in financial markets, where the human element of emotion can create a chaotic and difficult-to-quantify effect, resulting in increased volatility.
Exchange Order Books
Exchange order books can provide further insight into these market dynamics. An order book is essentially a list of current buy and sell orders for a specific asset. It shows not only the price at which buyers and sellers are willing to transact, but also how many units they seek to buy or sell at each price.
In a bull market, you would typically see a large number of buy orders (bids) in the order book. This represents the high demand and the willingness of investors to buy at higher prices. The sell orders (asks), on the other hand, would be fewer as holders are not eager to sell.
In contrast, in a bear market, the order book would be dominated by sell orders. This represents the increased supply as investors look to sell their assets. The buy orders would be fewer as investors are reluctant to buy in a falling market.
The order book also shows the 'depth' of the market at each price level. In a bull market, the market depth at higher prices would be significant as investors are willing to buy even at elevated prices. In a bear market, the market depth at lower prices would be higher, indicating the willingness of investors to sell at lower prices.
Conclusion
Understanding the dynamics of bull and bear markets can provide valuable insights for investors and traders. The sharp peaks in bull markets and the prolonged troughs in bear markets are a reflection of the underlying market psychology and level of participation. The dynamics of supply and demand, as reflected in the exchange order books, play a crucial role in shaping the price action in bull and bear markets. The mania during bull markets often leads to sharp price increases, while the panic in bear markets results in more prolonged and less sharp declines. The larger participation in bull markets compared to bear markets further accentuates these trends. By understanding these dynamics, investors can better navigate the financial markets and make more informed investment decisions.
References
How the Power of the Masses Drives the Market - Investopedia
How to Bear a Bull Market: The Psychology of Volatile Securities Trading - Scientific American
The Anatomy of a Bear Market - Arbor Asset Allocation Model Portfolio (AAAMP) Blog
The Anatomy of a Bull Market - Arbor Asset Allocation Model Portfolio (AAAMP) Blog